Azeria Labs Azeria Labs
  • ARM Assembly
    • Part 1: Introduction to ARM Assembly
    • Part 2: ARM Data Types and Registers
    • Part 3: ARM Instruction Set
    • Part 4: Memory Instructions: LDR/STR
    • Part 5: Load and Store Multiple
    • Part 6: Conditional Execution and Branching
    • Part 7: Stack and Functions
    • Assembly Basics Cheatsheet
  • Online Assembler
  • Exploitation
    • Writing ARM Shellcode
    • TCP Bind Shell in Assembly (ARM 32-bit)
    • TCP Reverse Shell in Assembly (ARM 32-bit)
    • Process Memory and Memory Corruption
    • Stack Overflows (Arm32)
    • Return Oriented Programming (Arm32)
    • Stack Overflow Challenges
    • Process Continuation Shellcode
    • Glibc Heap – malloc
    • Glibc Heap – free, bins, tcache
    • Part 1: Heap Exploit Development
    • Part 2: Heap Overflows and the iOS Kernel
    • Part 3: Grooming the iOS Kernel Heap
  • Lab Environment
    • ARM Lab VM 1.0
    • ARM Lab VM 2.0
    • Debugging with GDB and GEF
    • Emulate Raspberry Pi with QEMU
    • Running Arm Binaries on x86 with QEMU-User
    • Emulating Arm Firmware
  • TrustZone Research
    • TEEs and Arm TrustZone
    • Trustonic’s Kinibi TEE
  • Self-Improvement
    • Deep Work & The 30-Hour Method
    • Paradox of Choice
    • The Process of Mastering a Skill
  • About

INTRODUCTION TO ROP ON ARM32

In my previous blog post “Stack Overflows on Arm32” you learned how functions work on Arm32 and the way a stack-overflow vulnerability can give you control over the program flow. But what can you do after you took control over the Program Counter (PC)? This blog post will teach you how to exploit a stack-overflow without exploit mitigations and how the XN exploit mitigation changes the way these vulnerabilities are exploited. You can download the Lab VM with the challenges and setup mentioned in this blog post.

To exploit a stack-overflow, you need to redirect the program flow to an instruction sequence that achieves a certain goal. What goal might that be? Hackers could execute shellcode to install malware, attack other components on the system, or simply open a reverse shell to get remote command-line access to the target. If you want to learn how to write a reverse shell in Arm assembly, you can follow my tutorial TCP Reverse Shell in Arm Assembly.

The way you can exploit a stack-overflow to execute your shellcode is by putting it on the stack and directing the program flow to jump to your shellcode and execute its instructions. You can find a simple shellcode example in my blog post Writing Arm Shellcode where I also explain how you can convert your shellcode into a hex string. This hex string is what lands on the stack and is being executed if you make the program branch to it, assuming the stack is executable.

After reading the previous blog post you know that you can overwrite the return address on the stack with a value of your choice. This means that you need to construct your input string to contain a number of characters to fill the buffer bytes plus the instruction you want to be executed next. But where do you take this instruction from? Let’s take a step back and look at the memory layout of our example program (mentioned here).

If you would like to follow this process, copy the code from the previous blog post over to your Arm environment, compile it without an executable stack and run it in GDB/GEF.

user@azeria-labs-arm:~$ gcc program.c -o program -z execstack
user@azeria-labs-arm:~$ gdb program
gef➤  b main
Breakpoint 1 at 0x560
gef➤  run

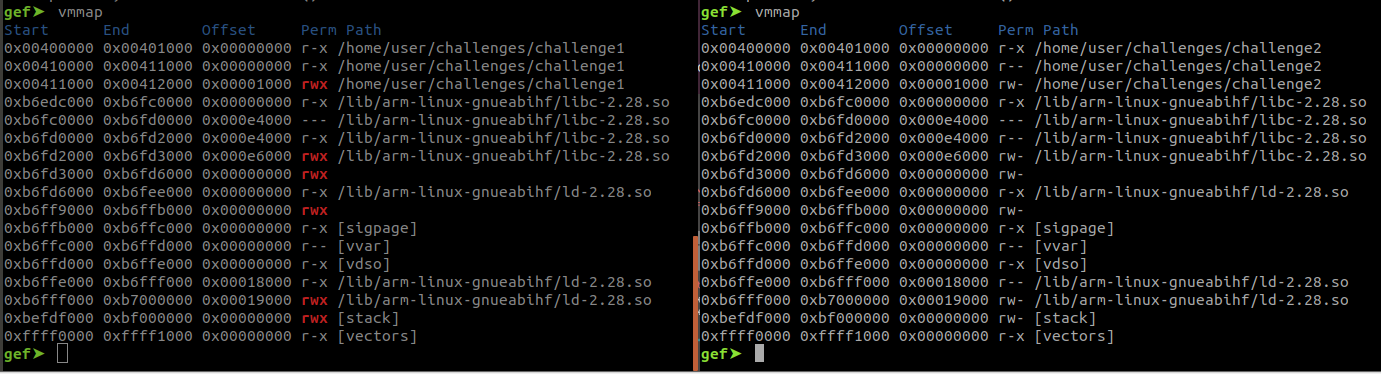
You can view the memory map of your binary with the command “vmmap”. If you want to learn more about debugging with GDB and GEF, check out my blog post Debugging with GDB.

gef➤ vmmap
Start End Offset Perm Path
0x00400000 0x00401000 0x00000000 r-x /home/user/program
0x00410000 0x00411000 0x00000000 r-x /home/user/program
0x00411000 0x00412000 0x00001000 rwx /home/user/program
0xb6edc000 0xb6fc0000 0x00000000 r-x /lib/arm-linux-gnueabihf/libc-2.28.so
0xb6fc0000 0xb6fd0000 0x000e4000 --- /lib/arm-linux-gnueabihf/libc-2.28.so
0xb6fd0000 0xb6fd2000 0x000e4000 r-x /lib/arm-linux-gnueabihf/libc-2.28.so
0xb6fd2000 0xb6fd3000 0x000e6000 rwx /lib/arm-linux-gnueabihf/libc-2.28.so
0xb6fd3000 0xb6fd6000 0x00000000 rwx 
0xb6fd6000 0xb6fee000 0x00000000 r-x /lib/arm-linux-gnueabihf/ld-2.28.so
0xb6ff9000 0xb6ffb000 0x00000000 rwx 
0xb6ffb000 0xb6ffc000 0x00000000 r-x [sigpage]
0xb6ffc000 0xb6ffd000 0x00000000 r-- [vvar]
0xb6ffd000 0xb6ffe000 0x00000000 r-x [vdso]
0xb6ffe000 0xb6fff000 0x00018000 r-x /lib/arm-linux-gnueabihf/ld-2.28.so
0xb6fff000 0xb7000000 0x00019000 rwx /lib/arm-linux-gnueabihf/ld-2.28.so
0xbefdf000 0xbf000000 0x00000000 rwx [stack]
0xffff0000 0xffff1000 0x00000000 r-x [vectors]

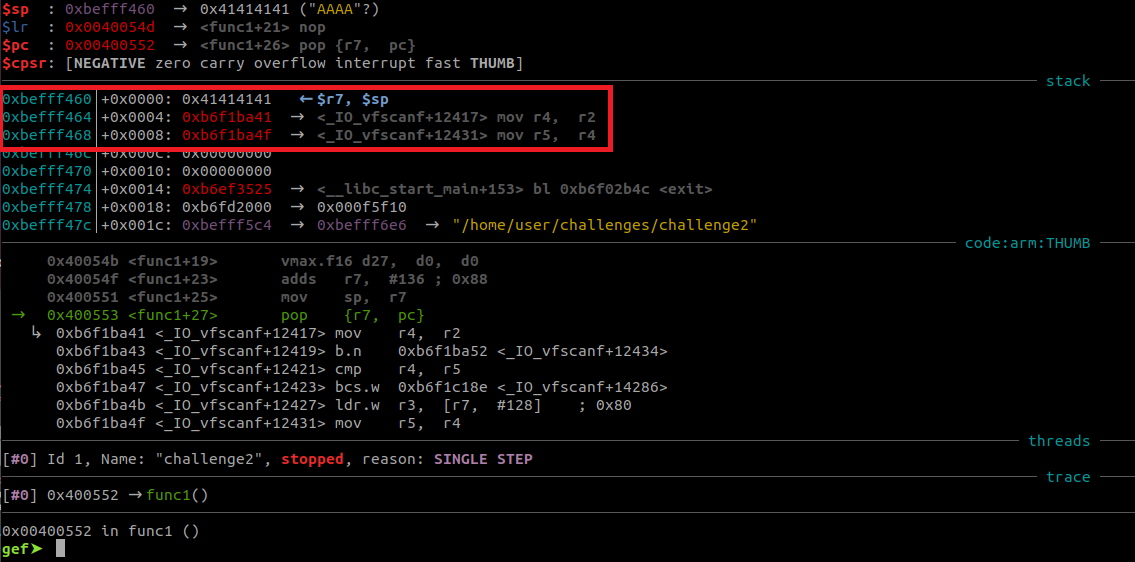
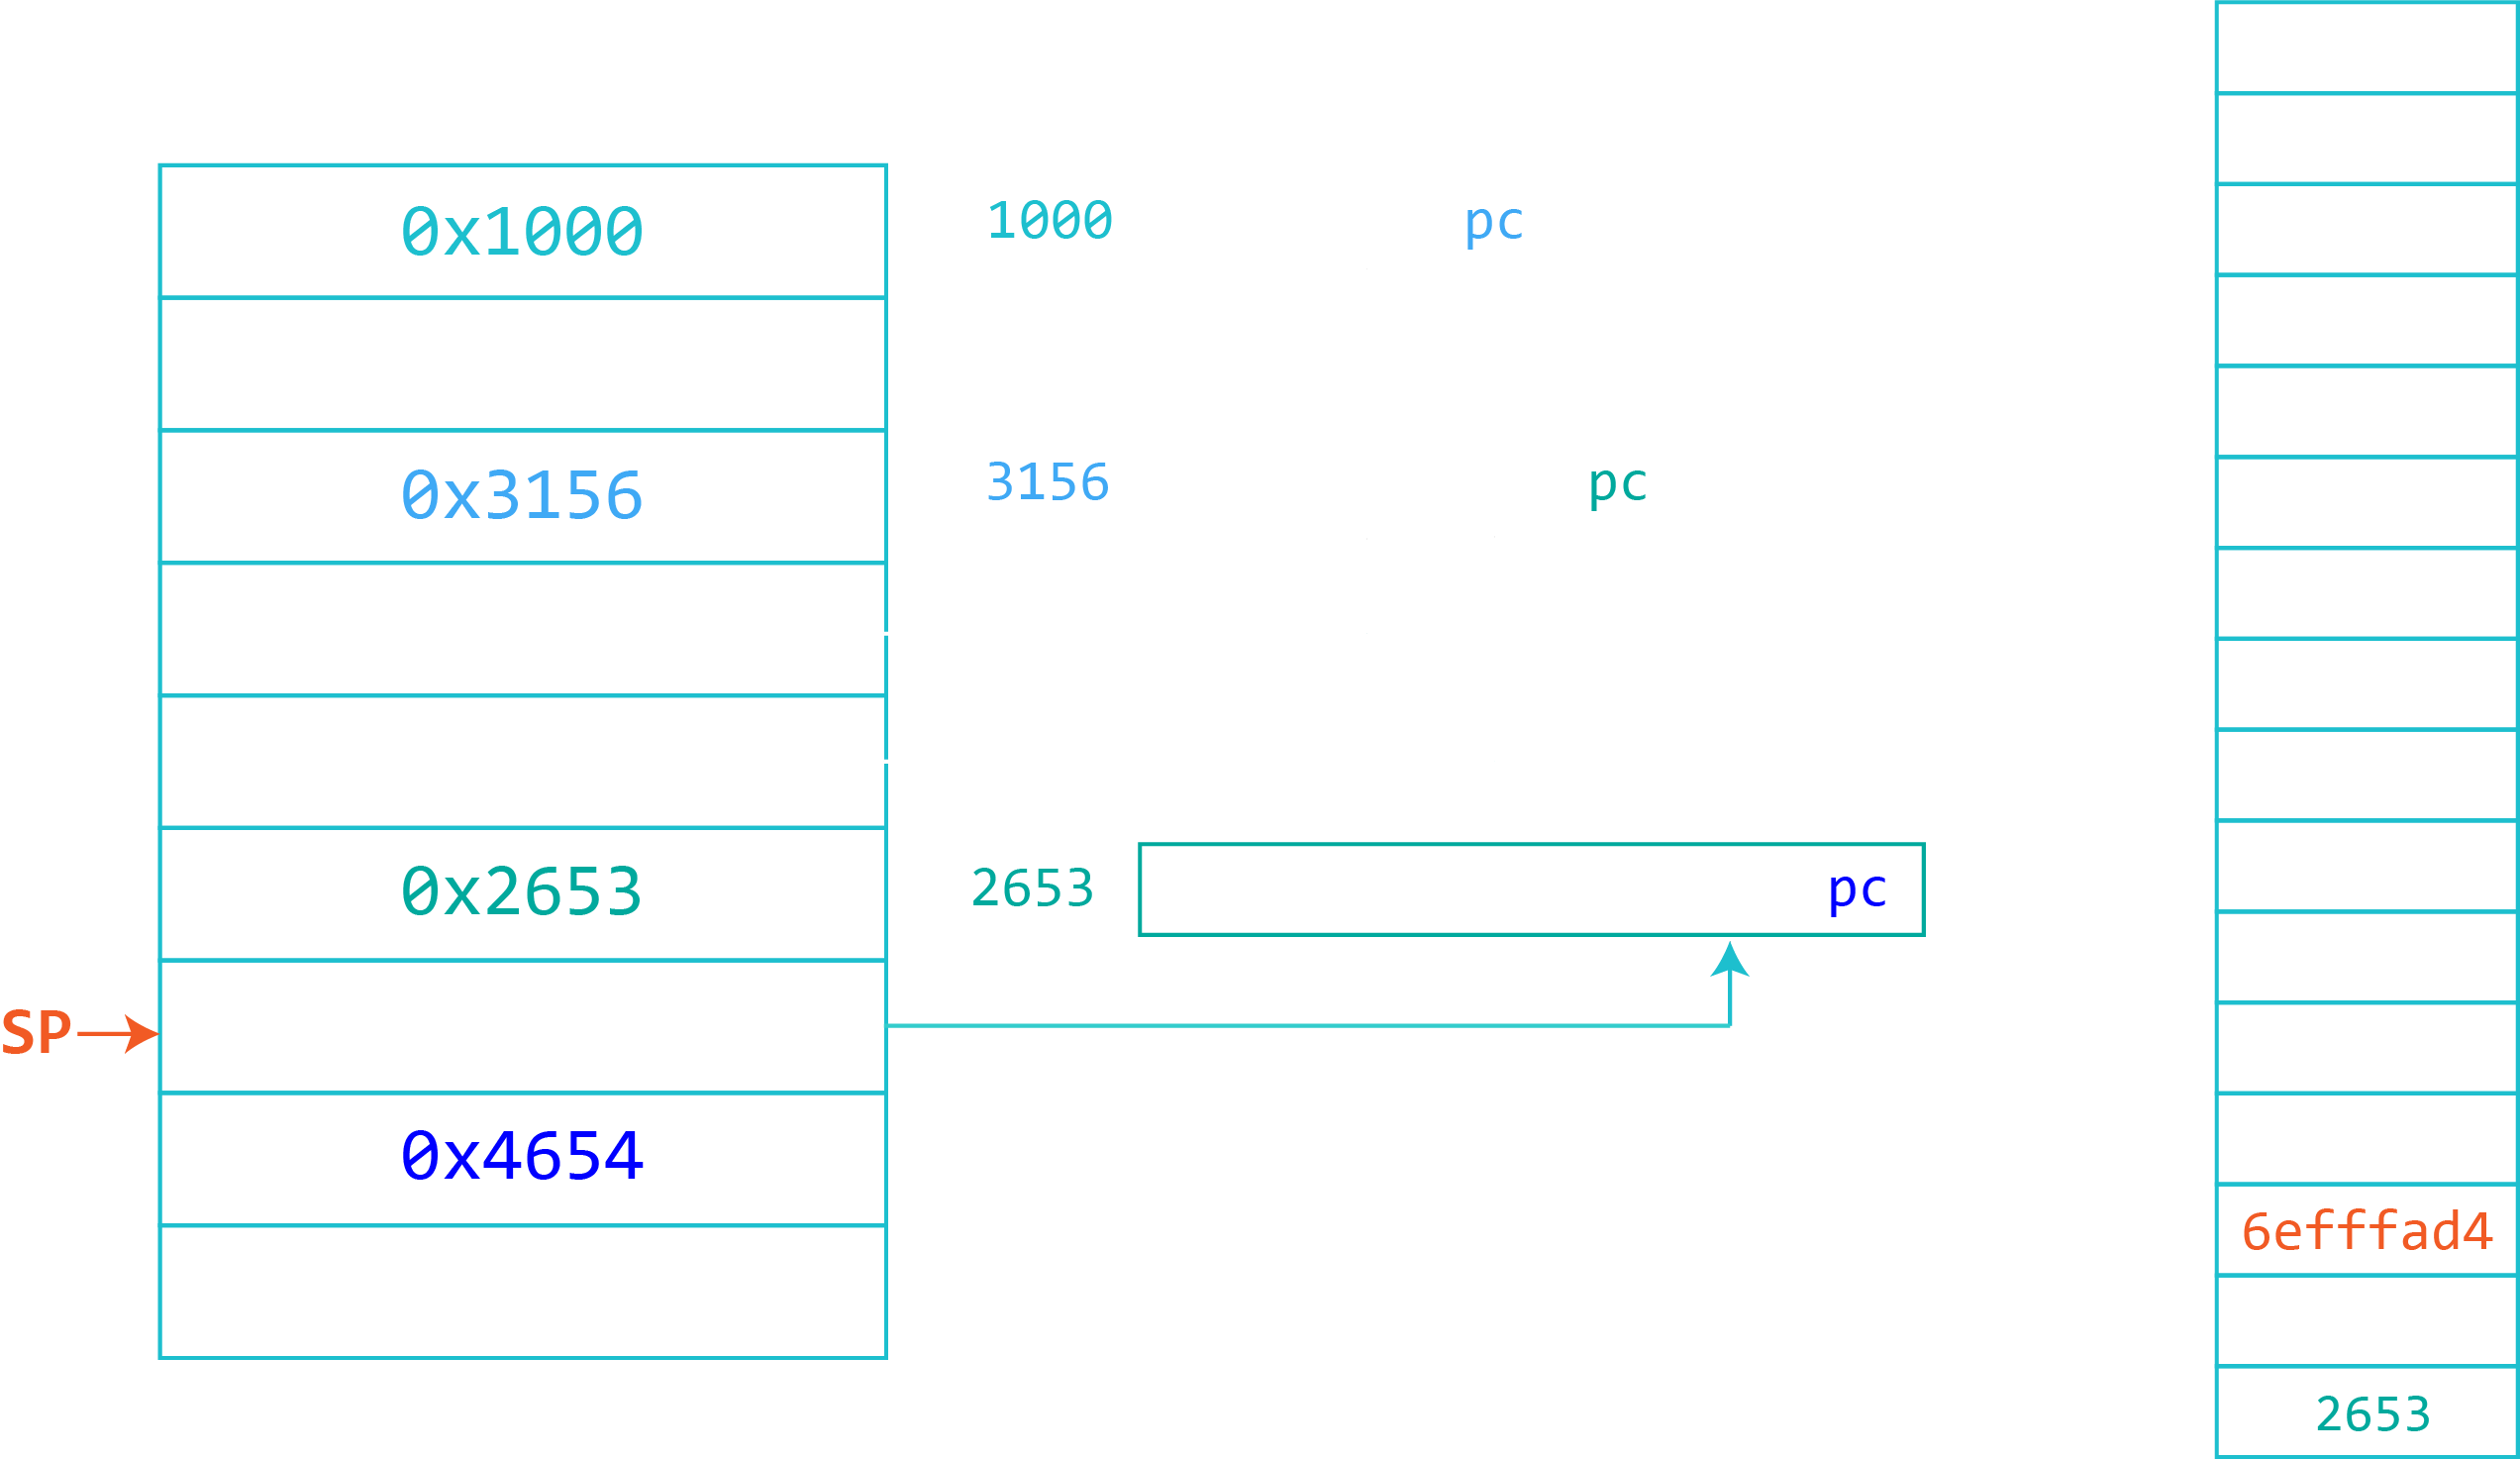
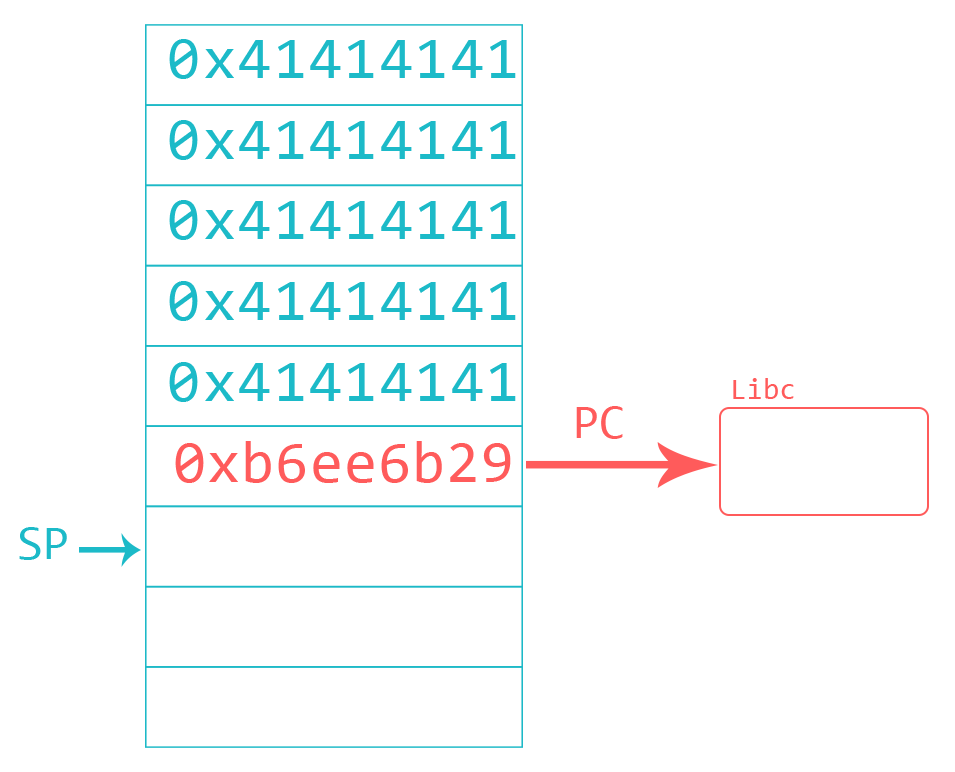
As you can see, the stack is read-write-execute. Let’s look at sections we can steal instructions from. The requirement for this is that this section contains executable parts, such as the libc library. You can make use of libraries loaded at predictable addresses and look for an instruction sequence that branches to your shellcode. You then overwrite the return address of your target with the address of that instruction sequence, also called “gadget”. If you went through my Arm Assembly tutorial, you have heard about branches (tutorial here). At the point when your gadget will be popped into PC, the Stack Pointer (SP) will point to the next 4 bytes on the stack. If you choose a gadget that branches to SP (like BX SP or BLX SP)  the processor will place the value of SP into PC. Since the SP is pointing to your shellcode, the processor will begin to execute your shellcode instructions.

If Address Space Layout Randomization (ASLR) is enabled, libraries (and other parts of the process memory) will be loaded at different memory addresses each time you execute the program. This makes it hard to predict the exact address of your gadget. I won’t cover ASLR internals and bypasses in this tutorial. For this example you can turn ASLR off with by executing the following command inside your Arm environment (or executing the disable_aslr.sh script):

user@azeria-labs-arm:~$ sudo sh -c "echo 0 > /proc/sys/kernel/randomize_va_space"

You can find gadgets with tools like Ropper. I suggest running Ropper on your host environment because running it from the Arm environment is slow. With vmmap you saw the file path of libc. Transfer this library over to your Ubuntu host:

user@Azeria-Lab-VM:~$ scp user@arm:/lib/arm-linux-gnueabihf/libc-2.28.so .
libc-2.28.so    100%    930KB    4.8MB/s    00:00

Now you can look for gadgets with Ropper:

user@Azeria-Lab-VM:~$ ropper
(ropper)> file libc-2.28.so
[INFO] Load gadgets for section: LOAD
[LOAD] loading... 100%
[LOAD] removing double gadgets... 100%
[INFO] File loaded.
(libc-2.28.so/ELF/ARMTHUMB)> search /1/ b%x sp
[INFO] Searching for gadgets: b%x sp

[INFO] File: libc-2.28.so
0x0001488c (0x0001488d): blx sp; 
0x0000a43c (0x0000a43d): bx sp;

You can use the % symbol to indicate that you want both, BX and BLX instructions. The /1/ tells Ropper to give you the smallest gadget sequence. Try it out and search for “mov r1” with and without the /1/. Messy, isn’t it?

You should always start your search with /1/ and only if you can’t find your “perfect gadget” you increase it to /2/, then /3/, and so on. You see two addresses for each instruction. This is because this library is mostly compiled with thumb instructions (intro to Arm and Thumb) and this is Ropper’s way of telling you that the address is off by 1 and you should take the green one (the one in brackets).

I won’t spoil the solution and let you have a little challenge. 🙂 You can download the Lab VM and try to write your own exploit. Hint: you can solve this in different ways. With a python script or by passing your payload through an environment variable, for example. The challenge for this part is “challenge1” inside the Arm environment in folder “challenges”.

Introduction to the XN Mitigation

In the previous section you learned how an unmitigated stack-overflow can be exploited by overwriting a function’s return address with the address of a BX SP gadget. When the function returns, the SP pointed to your shellcode on the stack and when the gadget caused the the PC to point to this address, the processor begins interpreting it as executable instructions.

To mitigate against this type of attack, processor manufacturers developed the “Execute Never” (XN) exploit mitigation that allows memory pages to be marked as not containing executable code. Attempts to perform an instruction fetch from a page marked XN will cause the processor to raise a translation fault to the operating system, usually leading the program to abort. The XN mitigation can mark stack memory, heap memory, and the data sections of program binaries as non-executable.

Let’s use challenge1 and challenge2 in the Lab VM as an example. Using the GDB/GEF command “vmmap” you can see that the permissions of certain sections are different. Challenge2 (on the right) was compiled with XN.

This mitigation counters the previous exploitation technique where you can execute shellcode directly from the stack. The vulnerability is still there; i.e., you can still overwrite the return address of the vulnerable function to redirect control-flow. If you run the same exploit, the BX SP gadget will still run; it is inside the code section of libc, and therefore not in “execute never” memory. Only on the next instruction, when the processor attempts to fetch instructions from the stack, will a translation fault occur because the stack’s memory is marked XN.

Bypassing XN with ROP

Naively, one might expect the Execute Never mitigation to prevent all memory corruption exploits. After all, it is rare for programs to intentionally place attacker-controllable data in executable memory during run-time. Unfortunately for defenders, hackers quickly found ways to bypass XN protections using an exploit technique called Return-Oriented Programming (ROP).

ROP is based on the observation that although it is not possible to divert control flow to directly execute data on the stack, it is still possible to divert control to gadgets inside libraries loaded at run-time. You can construct a ROP chain of these gadgets that set up registers and invoke a library function such as System(). Invoking the system() API call is a forensically noisy, but common choice. This API takes a single parameter from R0, which points to a command string, and interprets it as a command to be executed as it it were entered via the command-line terminal.

You might be wondering how you would chain your chosen instructions together so they execute one after another. Let’s take a step back and see what happens if we chose simple instructions without the “chaining component”.

Instead using Ropper (which only returns chain-able gadgets), let’s manually grep for two MOV instructions.

user@azeria-labs-arm:~$ objdump -d /lib/arm-linux-gnueabihf/libc-2.28.so | grep mov
[...]
   3fa40:	4614      	mov	r4, r2
   3fa4e:	4625      	mov	r5, r4
   3fa52:	4629      	mov	r1, r5
   3fa64:	461a      	mov	r2, r3
[...]

The first two instructions in this shortened list look good (it doesn’t really matter). The value you see on the left is the offset of this instruction inside libc. This means you need to add the base address (start) of libc to this offset to get the actual address of this instruction (assuming ASLR is disabled). You can find the base address of libc in different ways, one of them is via vmmap in GDB. If you scroll up, you can see that the the base address is 0xb6edc000. So our first instruction is at 0xb6edc000 + 0x3fa40 + 1. Why +1? This libc library is mostly compiled in Thumb, and 16-bit Thumb instructions are 2-byte aligned (rather than 4-byte aligned).

After setting a breakpoint in func1 and running the payload with those two gadgets, you can see the tail end of your padding bytes (A’s to fill the buffer until return address) and the addresses of the two instructions on the stack. PC points to the func1 instruction that will pop 0x41414141 into R7 and your first instruction into PC.

But what happens after the first instruction was executed? Will it execute the second one we specified? As you can see in the screenshot below, execution just continues at the next instruction in libc. In this case, we happened to have chosen an instruction from _IO_vfscanf and the processor will just continue executing from there.

If you want to set up registers with specific parameters to invoke system(), for example, you need to chain multiple instructions together. But if you choose stand-alone instructions, you lose control over the program flow.

This is why we use Ropper to search for gadgets. Ropper only returns instruction sequences that end with an instruction that can be chained together. You will see instruction sequences that end with POP {$register, PC} or branch instructions like BX $register. If your gadget ends with a POP PC, the next value on the stack will be executed. For instructions that branch to a register, you would need to pre-fill that register with your next gadget address. Here is an example:

Now it’s your turn. On the Lab VM, inside the Arm environment, you can find two challenges. Challenge1 is compiled without XN and challenge2 is compiled with XN. For the XN bypass, you can invoke System(“/bin/sh”) by making R0 point to the /bin/sh string on the stack, and filling PC with the address of system (grep system on libc). Happy hacking!

ARM Exploit Development

  • Writing ARM Shellcode
  • TCP Bind Shell (ARM 32-bit)
  • TCP Reverse Shell (ARM 32-bit)
  • Process Memory and Memory Corruption
  • Stack Overflows (Arm32)
  • Return Oriented Programming (Arm32)
  • Stack Overflow Challenges
  • Process Continuation Shellcode
  • Introduction to Glibc Heap (malloc)
  • Introduction to Glibc Heap (free, bins)
  • Heap Exploit Development (Part 1)
  • Heap Overflows and iOS Kernel (Part 2)
  • Grooming the iOS Kernel Heap (Part 3)

Twitter: @Fox0x01 and @azeria_labs

New ARM Assembly Cheat Sheet

Poster Digital

Cheat Sheet
© 2017-2022 Azeria Labs™ | All Rights Reserved.