This is a very brief introduction into compiling ARM binaries and basic debugging with GDB. As you follow the tutorials, you might want to follow along and experiment with ARM assembly on your own. In that case, you would either need a spare ARM device, or you just set up your own Lab environment in a VM by following the steps in this short How-To.
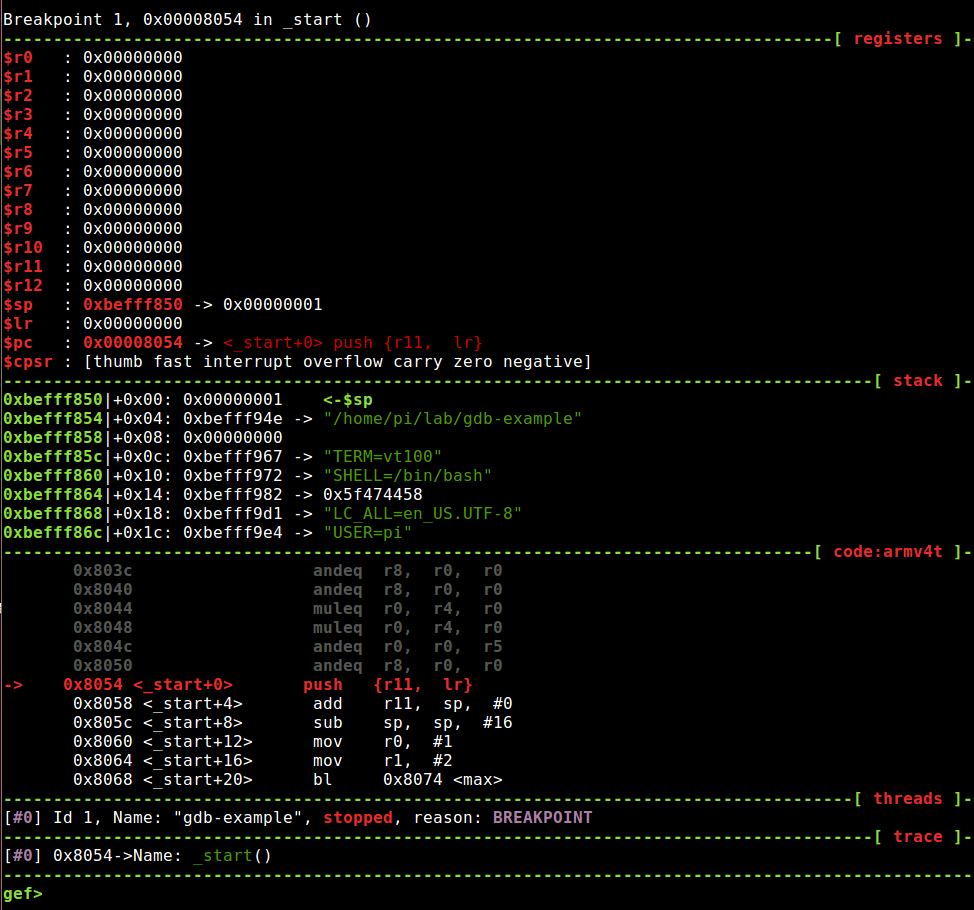
You can use the following code from Part 7 – Stack and Functions, to get familiar with basic debugging with GDB.
.section .text
.global _start

_start:
    push {r11, lr}    /* Start of the prologue. Saving Frame Pointer and LR onto the stack */
    add r11, sp, #0   /* Setting up the bottom of the stack frame */
    sub sp, sp, #16   /* End of the prologue. Allocating some buffer on the stack */
    mov r0, #1        /* setting up local variables (a=1). This also serves as setting up the first parameter for the max function */
    mov r1, #2        /* setting up local variables (b=2). This also serves as setting up the second parameter for the max function */
    bl max            /* Calling/branching to function max */
    sub sp, r11, #0   /* Start of the epilogue. Readjusting the Stack Pointer */
    pop {r11, pc}     /* End of the epilogue. Restoring Frame pointer from the stack, jumping to previously saved LR via direct load into PC */

max:
    push {r11}        /* Start of the prologue. Saving Frame Pointer onto the stack */
    add r11, sp, #0   /* Setting up the bottom of the stack frame */
    sub sp, sp, #12   /* End of the prologue. Allocating some buffer on the stack */
    cmp r0, r1        /* Implementation of if(a<b) */
    movlt r0, r1      /* if r0 was lower than r1, store r1 into r0 */
    add sp, r11, #0   /* Start of the epilogue. Readjusting the Stack Pointer */
    pop {r11}         /* restoring frame pointer */
    bx lr             /* End of the epilogue. Jumping back to main via LR register */
Personally, I prefer using GEF as a GDB extension. It gives me a better overview and useful features. You can try it out here: GEF – GDB Enhanced Features.
Save the code above in a file called max.s and compile it with the following commands:
$ as max.s -o max.o
$ ld max.o -o max
The debugger is a powerful tool that can:
- Load a memory dump after a crash (post-mortem debugging)
- Attach to a running process (used for server processes)
- Launch a program and debug it
Launch GDB against either a binary, a core file, or a Process ID:
- Attach to a process: $ gdb -pid $(pidof <process>)
- Debug a binary: $ gdb ./file
- Inspect a core (crash) file: $ gdb -c ./core.3243
$ gdb max
If you installed GEF, it drops you the gef> prompt.
This is how you get help:
- (gdb) h
- (gdb) apropos <search-term>
gef> apropos registers
collect -- Specify one or more data items to be collected at a tracepoint
core-file -- Use FILE as core dump for examining memory and registers
info all-registers -- List of all registers and their contents
info r -- List of integer registers and their contents
info registers -- List of integer registers and their contents
maintenance print cooked-registers -- Print the internal register configuration including cooked values
maintenance print raw-registers -- Print the internal register configuration including raw values
maintenance print registers -- Print the internal register configuration
maintenance print remote-registers -- Print the internal register configuration including each register's
p -- Print value of expression EXP
print -- Print value of expression EXP
registers -- Display full details on one
set may-write-registers -- Set permission to write into registers
set observer -- Set whether gdb controls the inferior in observer mode
show may-write-registers -- Show permission to write into registers
show observer -- Show whether gdb controls the inferior in observer mode
tui reg float -- Display only floating point registers
tui reg general -- Display only general registers
tui reg system -- Display only system registers
Breakpoint commands:
- break (or just b) <function-name>
- break <line-number>
- break filename:function
- break filename:line-number
- break *<address>
- break +<offset>
- break –<offset>
- tbreak (set a temporary breakpoint)
- del <number> (delete breakpoint number x)
- delete (delete all breakpoints)
- delete <range> (delete breakpoint ranges)
- disable/enable <breakpoint-number-or-range> (does not delete breakpoints, just enables/disables them)
- continue (or just c) – (continue executing until next breakpoint)
- continue <number> (continue but ignore current breakpoint number times. Useful for breakpoints within a loop.)
- finish (continue to end of function)
gef> break _start
gef> info break
Num Type Disp Enb Address What
1 breakpoint keep y 0x00008054 <_start>
 breakpoint already hit 1 time
gef> del 1
gef> break *0x0000805c
Breakpoint 2 at 0x805c
gef> break _start
This deletes the first breakpoint and sets a breakpoint at the specified memory address. When you run the program, it will break at this exact location. If you would not delete the first breakpoint and just set a new one and run, it would break at the first breakpoint.
Start and Stop:
- Start program execution from beginning of the program
- run
- r
- run <command-line-argument>
- Stop program execution
- kill
- Exit GDB debugger
- quit
- q
gef> run

Now that our program broke exactly where we wanted, it’s time to examine the memory. The command “x” displays memory contents in various formats.
| Syntax: x/<count><format><unit> | |
|---|---|
| FORMAT | UNIT |
| x – Hexadecimal | b – bytes |
| d – decimal | h – half words (2 bytes) |
| i – instructions | w – words (4 bytes) |
| t – binary (two) | g – giant words (8 bytes) |
| o – octal | |
| u – unsigned | |
| s – string | |
| c – character | |
gef> x/10i $pc
=> 0x8054 <_start>: push {r11, lr}
 0x8058 <_start+4>: add r11, sp, #0
 0x805c <_start+8>: sub sp, sp, #16
 0x8060 <_start+12>: mov r0, #1
 0x8064 <_start+16>: mov r1, #2
 0x8068 <_start+20>: bl 0x8074 <max>
 0x806c <_start+24>: sub sp, r11, #0
 0x8070 <_start+28>: pop {r11, pc}
 0x8074 <max>: push {r11}
 0x8078 <max+4>: add r11, sp, #0
gef> x/16xw $pc
0x8068 <_start+20>: 0xeb000001  0xe24bd000  0xe8bd8800  0xe92d0800
0x8078 <max+4>:     0xe28db000  0xe24dd00c  0xe1500001  0xb1a00001
0x8088 <max+20>:    0xe28bd000  0xe8bd0800  0xe12fff1e  0x00001741
0x8098:             0x61656100  0x01006962  0x0000000d  0x01080206
Commands for stepping through the code:
- Step to next line of code. Will step into a function
- stepi
- s
- step <number-of-steps-to-perform>
- Execute next line of code. Will not enter functions
- nexti
- n
- next <number>
- Continue processing until you reach a specified line number, function name, address, filename:function, or filename:line-number
- until
- until <line-number>
- Show current line number and which function you are in
- where
gef> nexti 5
...
0x8068 <_start+20> bl 0x8074 <max> <- $pc
0x806c <_start+24> sub sp, r11, #0
0x8070 <_start+28> pop {r11, pc}
0x8074 <max> push {r11}
0x8078 <max+4> add r11, sp, #0
0x807c <max+8> sub sp, sp, #12
0x8080 <max+12> cmp r0, r1
0x8084 <max+16> movlt r0, r1
0x8088 <max+20> add sp, r11, #0
Examine the registers with info registers or i r
gef> info registers
r0     0x1     1
r1     0x2     2
r2     0x0     0
r3     0x0     0
r4     0x0     0
r5     0x0     0
r6     0x0     0
r7     0x0     0
r8     0x0     0
r9     0x0     0
r10    0x0     0
r11    0xbefff7e8 3204446184
r12    0x0     0
sp     0xbefff7d8 0xbefff7d8
lr     0x0     0
pc     0x8068  0x8068 <_start+20>
cpsr   0x10    16
The command “info registers” gives you the current register state. We can see the general purpose registers r0-r12, and the special purpose registers SP, LR, and PC, including the status register CPSR. The first four arguments to a function are generally stored in r0-r3. In this case, we manually moved values to r0 and r1.
Show process memory map:
gef> info proc map
process 10225
Mapped address spaces:

 Start Addr   End Addr    Size     Offset objfile
     0x8000     0x9000  0x1000          0   /home/pi/lab/max
 0xb6fff000 0xb7000000  0x1000          0          [sigpage]
 0xbefdf000 0xbf000000 0x21000          0            [stack]
 0xffff0000 0xffff1000  0x1000          0          [vectors]
With the command “disassemble” we look through the disassembly output of the function max.
gef> disassemble max
 Dump of assembler code for function max:
 0x00008074 <+0>: push {r11}
 0x00008078 <+4>: add r11, sp, #0
 0x0000807c <+8>: sub sp, sp, #12
 0x00008080 <+12>: cmp r0, r1
 0x00008084 <+16>: movlt r0, r1
 0x00008088 <+20>: add sp, r11, #0
 0x0000808c <+24>: pop {r11}
 0x00008090 <+28>: bx lr
 End of assembler dump.
GEF specific commands (more commands can be viewed using the command “gef”):
- Dump all sections of all loaded ELF images in process memory
- xfiles
- Enhanced version of proc map, includes RWX attributes in mapped pages
- vmmap
- Memory attributes at a given address
- xinfo
- Inspect compiler level protection built into the running binary
- checksec
gef> xfiles
     Start        End  Name File
0x00008054 0x00008094 .text /home/pi/lab/max
0x00008054 0x00008094 .text /home/pi/lab/max
0x00008054 0x00008094 .text /home/pi/lab/max
0x00008054 0x00008094 .text /home/pi/lab/max
0x00008054 0x00008094 .text /home/pi/lab/max
0x00008054 0x00008094 .text /home/pi/lab/max
0x00008054 0x00008094 .text /home/pi/lab/max
0x00008054 0x00008094 .text /home/pi/lab/max
0x00008054 0x00008094 .text /home/pi/lab/max
0x00008054 0x00008094 .text /home/pi/lab/max
gef> vmmap
     Start        End     Offset Perm Path
0x00008000 0x00009000 0x00000000 r-x /home/pi/lab/max
0xb6fff000 0xb7000000 0x00000000 r-x [sigpage]
0xbefdf000 0xbf000000 0x00000000 rwx [stack]
0xffff0000 0xffff1000 0x00000000 r-x [vectors]
gef> xinfo 0xbefff7e8
----------------------------------------[ xinfo: 0xbefff7e8 ]----------------------------------------
Found 0xbefff7e8
Page: 0xbefdf000 -> 0xbf000000 (size=0x21000)
Permissions: rwx
Pathname: [stack]
Offset (from page): +0x207e8
Inode: 0
gef> checksec
[+] checksec for '/home/pi/lab/max'
Canary:                  No
NX Support:              Yes
PIE Support:             No
RPATH:                   No
RUNPATH:                 No
Partial RelRO:           No
Full RelRO:              No

